


The Retail Investor's Parlor Game in Charts
I was interested in understanding the recovery following last Monday's selloff, and what was driving it. Found some cool stuff and even related it to class! How often does that happen?!

A week ago and some change, the release of Deepseek R1, which had occurred a week before on January 20th, sent waves through some of the market’s biggest names. In creating a reasoning model on par with ChatGPT’s o1 at a far lower cost, Deepseek showed the market for data center servers, GPU and lest we forget energy may have a ceiling. This runs contrary to the bottomless spending being undertaken by the hyperscalers, who “are good for their $80 billion.” Now, far smarter people than myself have spent time analyzing the technology behind DeepSeek, and I’ll plug this Youtube video for anyone interested in precisely why Marc Andreesen provocatively claimed that “Deepseek R1 is AI’s Sputnik moment.”
I’d rather spend some time talking about a market observation I’ve made since last Monday, which may or may not be important, but I found interesting.
In my behavioral finance class, we learned yesterday of a phenomenon in which the experience effect influences investing habits. The observation was made by Stefan Nagel and Ulrike Malmendier, who noted in a 2015 paper a data observation of inflation expectations for different age ranges, with particular dispersion in the 1980s, when inflation was rampant. They found that those with age <40 were bearish on inflation subsiding because they had yet to experience a time of high inflation. Conversely, those older than 60 had the experience of high inflation, perhaps from the post-war mismatch of supply and demand.

In a similar vein, I believe this psychology can be observed in the context of the changing demographics of the retail investor base. JP Morgan shows in a chart below that the annual share of individuals transferring funds to investment accounts increased by a 6x order of magnitude in 2021 relative to its baseline average from 2010-2015. Further, we can observe just a 3.5x increase for those older than 40, showing the growth (trough to peak) was far less.
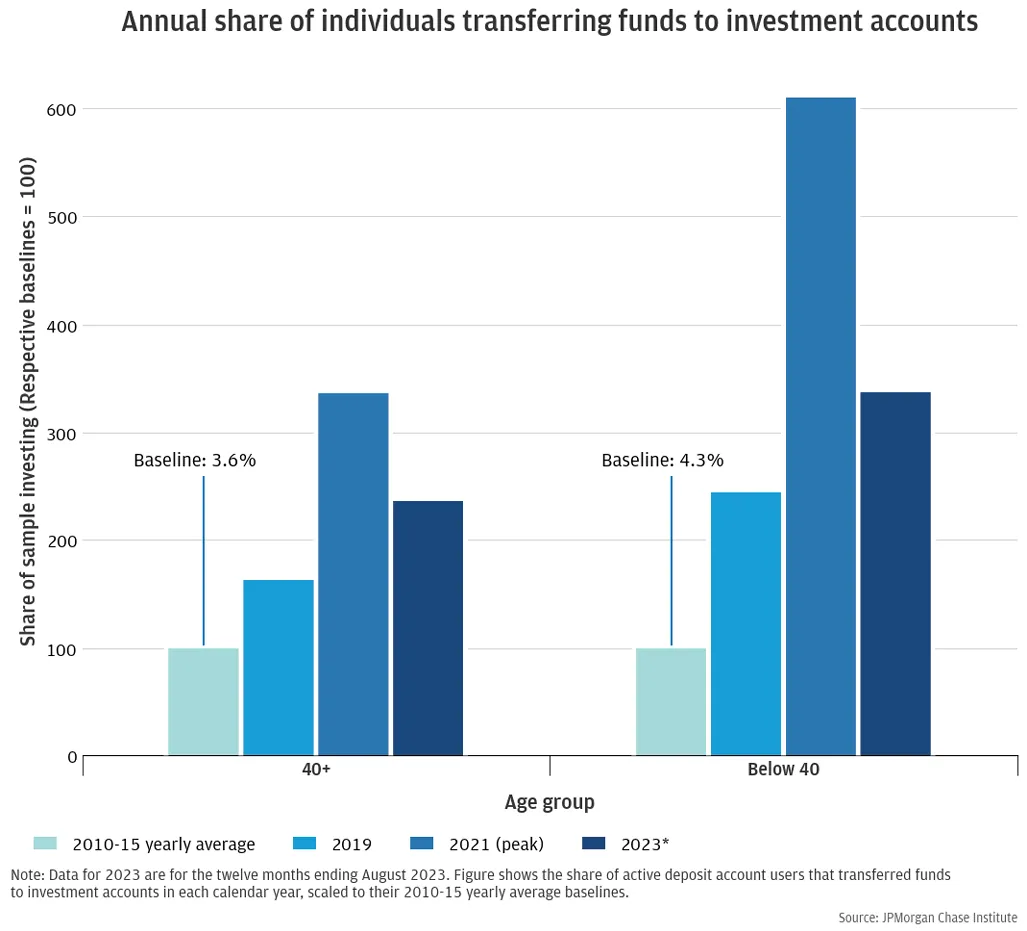
Now, I know what you may be thinking. Of course they’re going to comprise a lower annual share, anyone thats 40+ probably opened an investment account when they were younger. But we can also find from a November 2024 retail investor survey run through TastyTrade that “the highest rate of investment participation are among those aged 35-44 (53%), followed closely by the 25-34 group (51%) and 18-24 (50%). Participation notably declines with age, dropping to just 33% for those over 65.” I promise I’ll bring this to Deepseek.

So we can see that the investing age skews a bit young. That’s neat, what else can we glean from the survey? Below, tastytrade finds that 51% of those surveyed (n=2,016) began investing in the last four years.

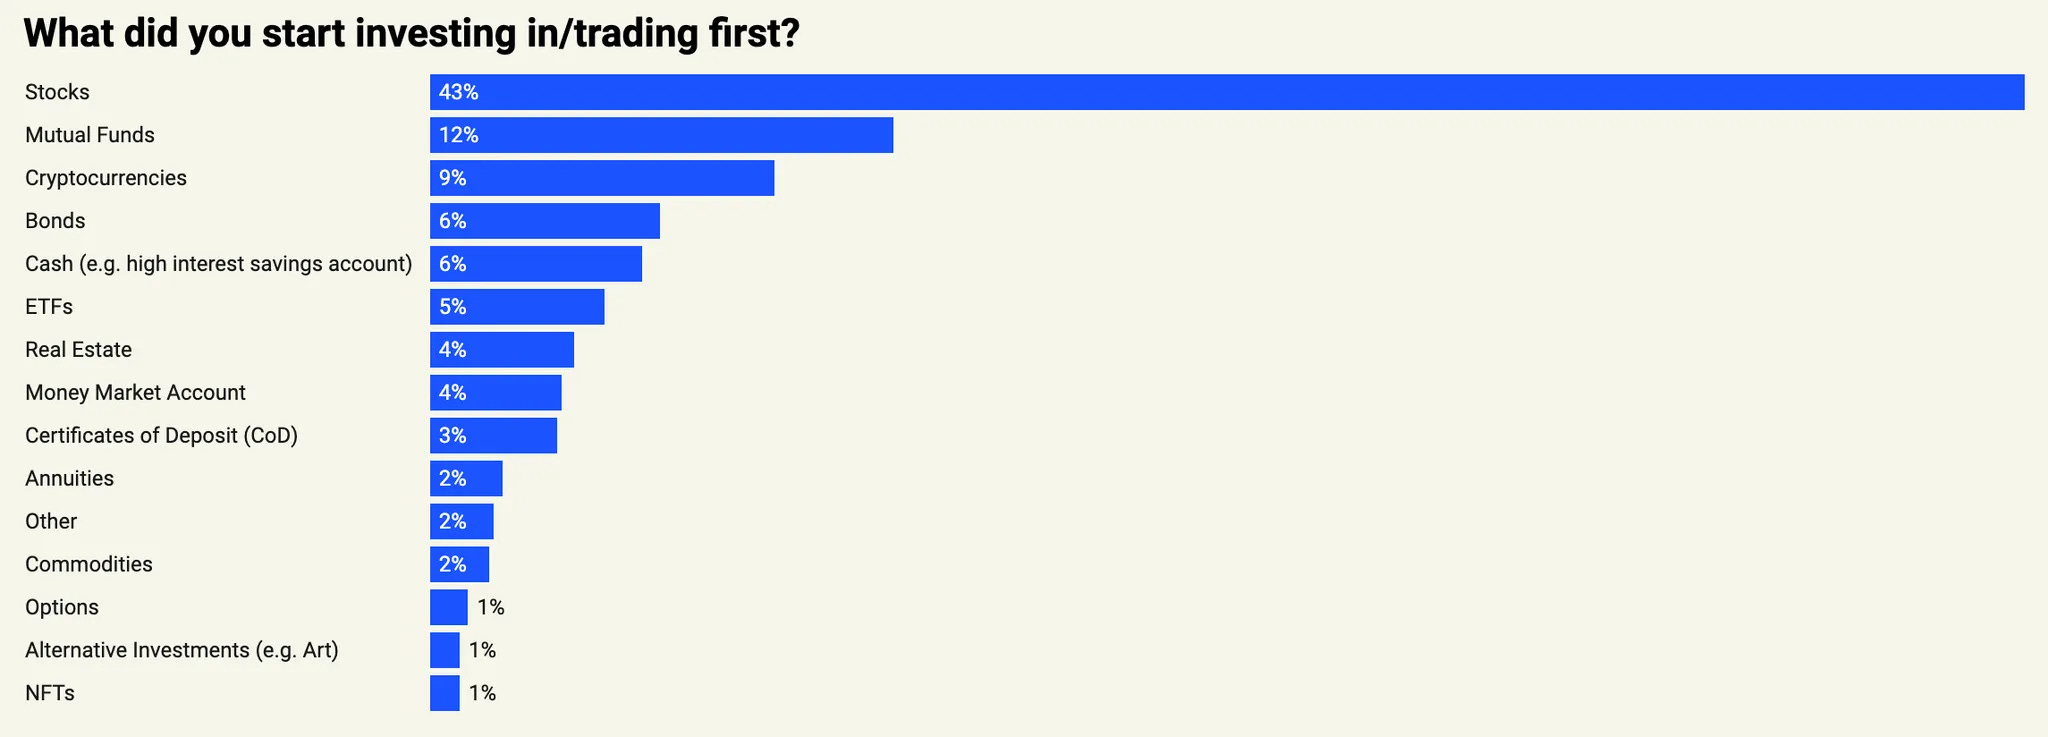
Then we can look at what people are investing in. The survey finds that 43% of people begin in stocks. That’s good, I was hoping to isolate stocks - bonds are boring, and real estate even moreso. So from this survey, we can find that, on a relative basis, more younger people are investing and have started recently, with the lion’s share of those having started recently beginning in stocks.
I want to now bring the experience effect to a historical scale, where the Federal Reserve Board was kind enough to map out a multivariate time series of stock market participation broken down by age variance on the x axis. We can see outliers at the low end of the age range (left on x-axis) in both the 1961-1963 period (purple) and the 1970-1972 (light blue) period. Weirdly, both of these events occur at “buy the dip” esque inflection points. (Disclaimer: this is the most “might be a stretch” part of this article)

Kennedy Slide of 1962: Market crash during early 1962 during which the S&P 500 decline by 22.5% and the Dow followed suit. Stock prices had been riding the glide path set by the post-war boom of the 1940s, but the Slide removed froth from the equity market, presenting a buying opportunity for young retail investors
1970-1972: Stocks reined in 1970 coming off an 18-month slide due to (1) rising deficits to fund Vietnam and (2) the Fed raising rates in 1968 and 1969 in response to high inflation

Source: Bloomberg

Now we can bring it to DeepSeek. I understand that what happened Monday was not synonymous with either of the events I mentioned above, in that it took place over an x-axis measured in minutes and hours, not days and months. But I nonetheless believe it continues on a historical precedent of “buy the dip” retail investor philosophy that interestingly contrasts with where smart money is moving at the moment.

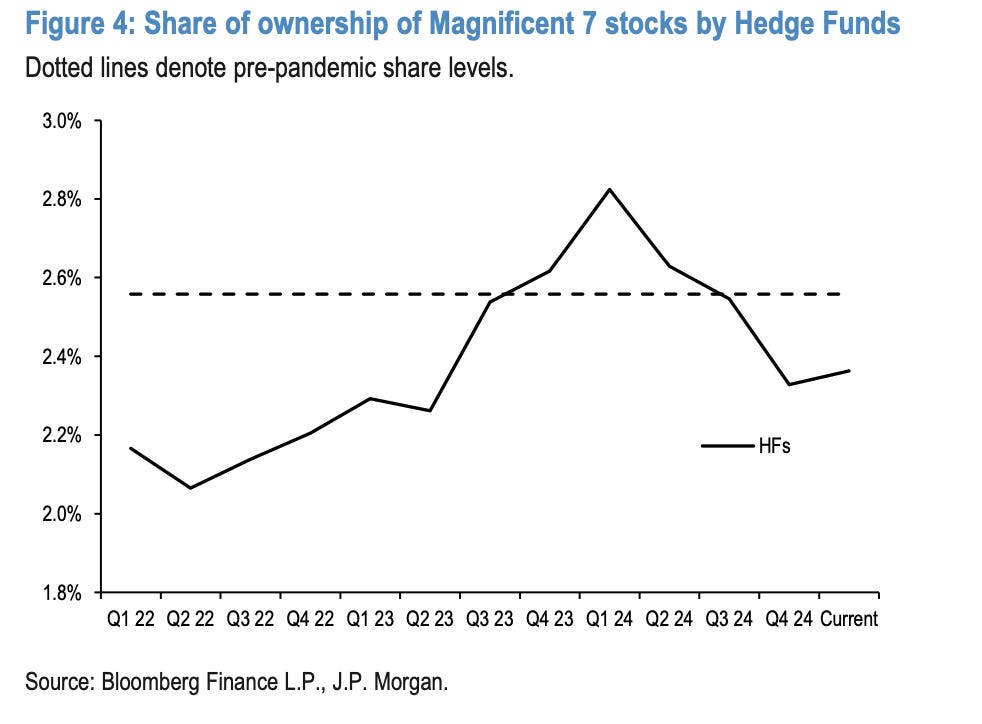
We can see that macro hedge funds are cutting long equity exposure, aligning with broader concerns about market fragility and AI-driven tech valuations as well as the removal of the ballast of a cutting cycle, at least in the short term. Let’s zoom into Mag 7.
On the flip side, Vanta shows us that on Monday, retail investors piled into NVDA at a record pace, with net flows exceeding $500M.

The trend persisted at a market level, as well where a J.P Morgan report shows $8 billion piling into the stock market last week, the largest inflow of the last two years.

Meanwhile we can track net buying of singles on January 27th via Robinhood. A few companies I have highlighted:
Semiconductors
NVDA: 40%
VRT: 47%
AMD: 14%
AVGO: 34%
Nuclear
CEG: 25%
VST: 36%
TLN: 24%
CCJ: 32%
What did this mean for the companies? Let’s have a look.

There was relatively low dispersion in the semis recovery, although ASML showed their chops by smashing their net bookings consensus and beating on sales guidance. There’s no rhyme or reason to why I picked these companies; just tried to demonstrate some of the most relevant names that came to mind without crowding the Bloomberg graph to point of unreadability.
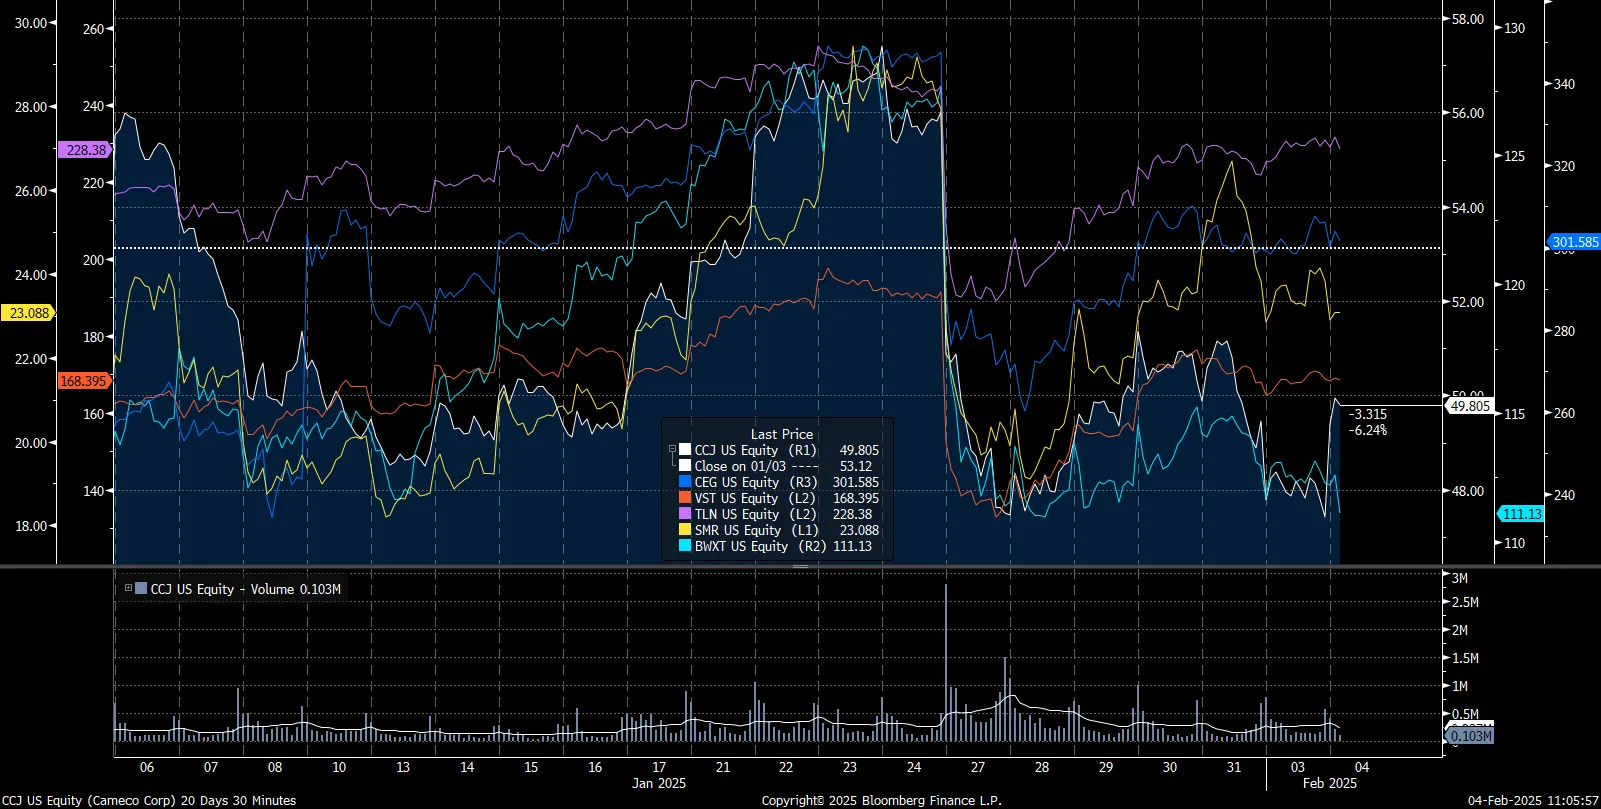
What’s fascinating is the relatively higher dispersion among nuclear energy names who have equally been on a rampage to start the year (Constellation’s acquisition of Calpine on 1/10 brought a lot of investor attention to the space). Post-Deepseek, performance dispersion shows these companies are viewed differently by investors, with the most government exposed BWX Technologies remaining the furthest in the doldrums. I hope to do a deeper dive into the nuclear trade in a future article, but recognized the contrast relative to the semis recovery.
All of this may mean absolutely nothing, and smart money will go about their day either reducing overall equity exposure or rotating into the broadening out trade. I’m personally a big believer in the latter, especially as it relates to software, where the true applications of AI will come to bear.
Regardless, last Monday’s events and the corresponding recovery (seemingly retail-driven) throughout the week present investors with an interesting decision with respect to U.S. equity exposure, one that I’m sure has gotten even more complicated with Trump’s tariffs (or lack thereof?).